Most carbon calculators ship with a default electricity factor from Europe or the United States. Apply one of those to a Kenyan factory and your Scope 2 emissions can be overstated by half or more. That is not a rounding error. It changes what your intensity looks like, where you sit against peers, and which projects your board will fund.
Kenya is different, and that is measurable
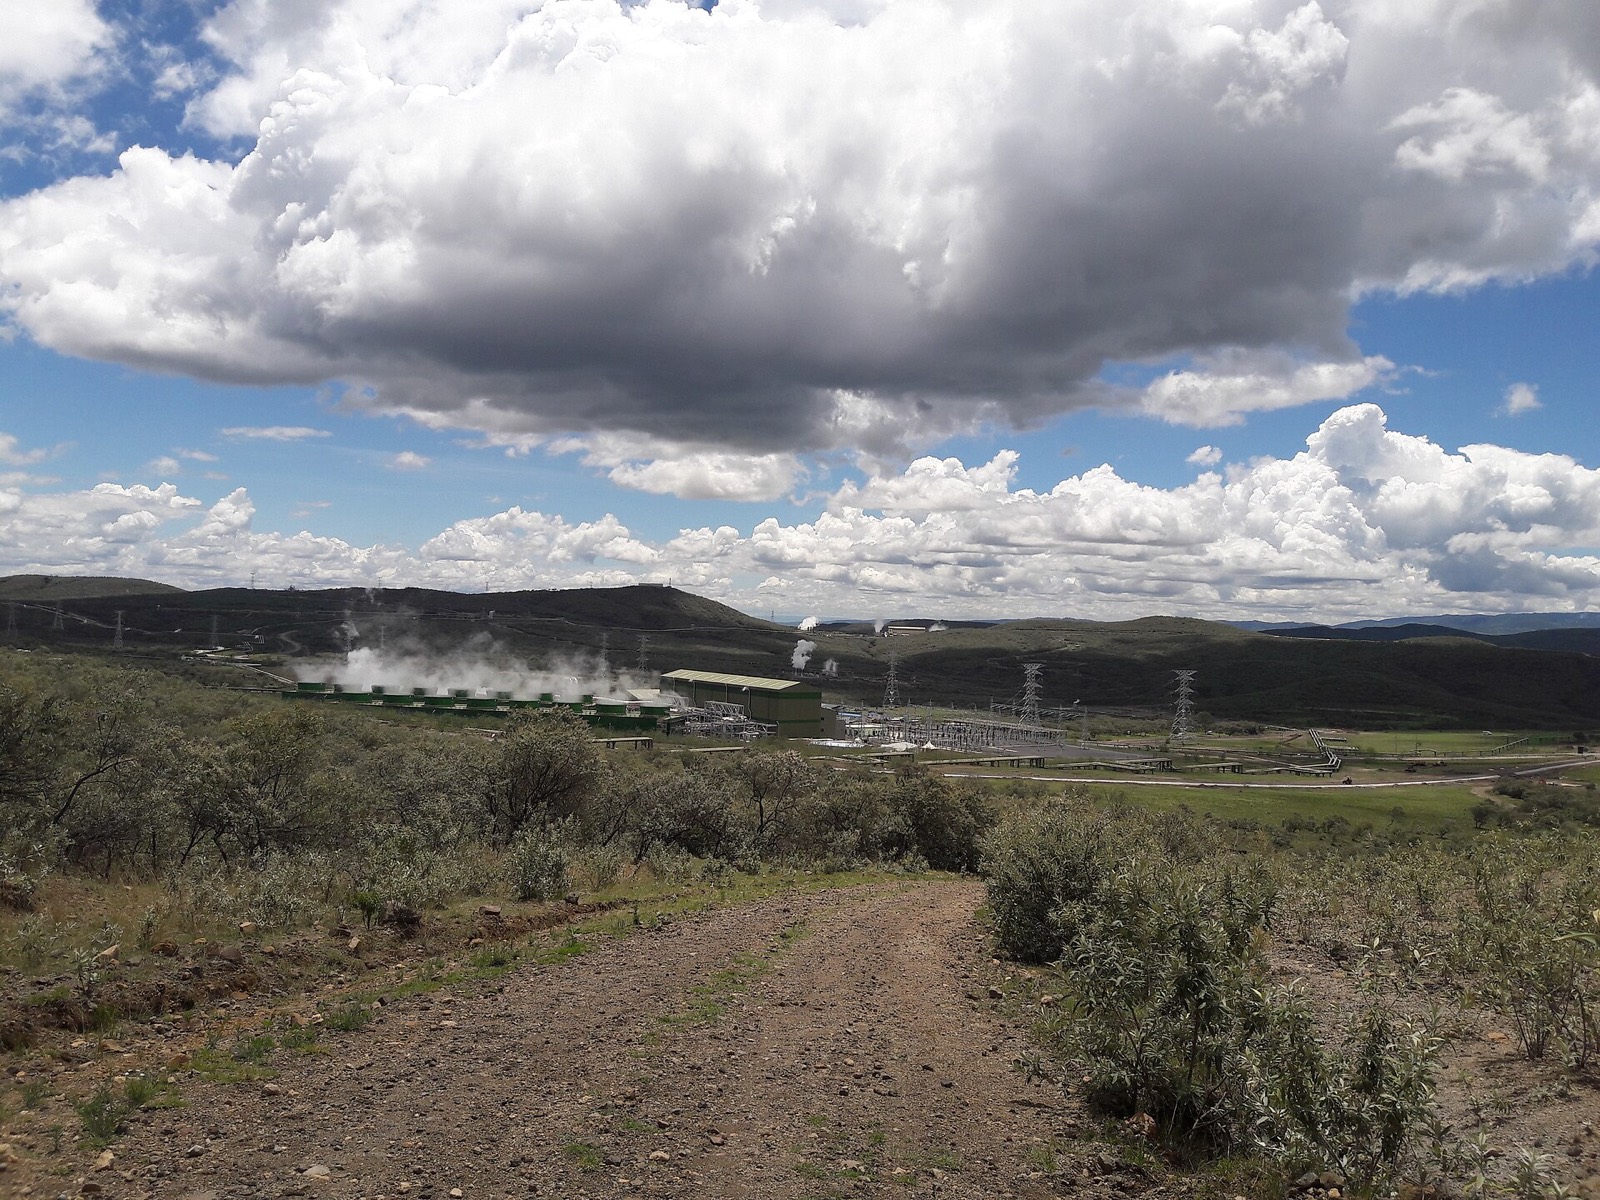
Around ninety percent of Kenya's grid electricity comes from geothermal, hydro, wind and solar. Olkaria alone supplies a large share of the country's baseload from steam, and the Ngong Hills and Lake Turkana wind farms add more. The result is a grid emission factor far below the global average. A kilowatt hour bought from Kenya Power carries a fraction of the carbon of one bought in South Africa, India or most of Europe.
That matters because Scope 2 is usually the largest line for an office-based company and one of the two largest for a manufacturer. Get the factor wrong and everything downstream of it is wrong too.
What an overstated Scope 2 does to your decisions
Three things go wrong at once.
- Your intensity per unit of production is inflated, so your benchmark position looks worse than it is and a lender or customer may price you accordingly.
- Your reduction plan chases the wrong lever. If electricity looks like sixty percent of your footprint, you will spend on efficiency lighting and rooftop solar. In Kenya the honest number often shows that diesel generators, process heat, refrigerants and fleet fuel are the bigger levers.
- Your baseline for a net zero target is wrong, which means every future claim of progress is built on sand.
What good practice looks like
Use a published national factor. Cite the source, the year and the version, and keep the citation with the number so an auditor can follow it. When the factor is updated, recalculate the affected periods and show the change rather than quietly replacing it.
Keep location-based and market-based Scope 2 apart. The location-based figure uses the grid average. The market-based figure reflects contracts and certificates you actually hold. Reporting one as the other is one of the commonest findings in assurance reviews, and IFRS S2 expects both where relevant.
Finally, record the data quality of the underlying activity data. A metered kilowatt hour from a utility bill is not the same as an estimate from floor area, and the two should not be blended without saying so.
How AfriESG handles it
The platform ships with a Kenyan grid factor preloaded and cited, keeps location-based and market-based Scope 2 as separate lines, records the factor version behind every tonne, and tags every activity line with a data quality tier. When you present the inventory to a bank, a customer or the board, every number traces back to a bill, a factor and a date.
If you are still using a default factor from a global template, the first honest thing you can do this quarter is replace it.
More from the blog

What the Kenya Green Finance Taxonomy means for lenders
Eleven sector appendices, one classification question, and what to do before the first taxonomy-aligned report goes to the regulator.

Biodiversity is the next line on your ESG report
TNFD, GRI 304 and Kenya's own conservation law are converging on one question: what does your business depend on in nature, and what does it affect? Here is how to start answering it.
What DOSH and GRI 403 both want from your safety data
Kenya's Occupational Safety and Health Act and the global GRI safety standard ask for overlapping numbers. Collect them once, correctly, and both the regulator and your customers are answered.
See it with a company like yours.
We do not demo with slides. Tell us your sector and we will walk you through a manufacturer, a bank or an agribusiness on the real platform, in about thirty minutes.
Pilots are open now. The platform launches in the first quarter of 2027.